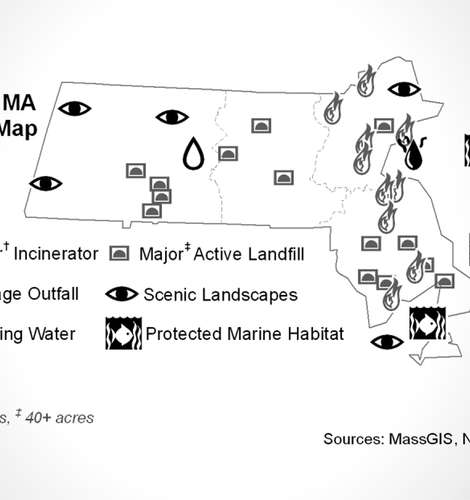
A Green Map uses a special set of symbols to show everything from parks to ponds, recycling centers to toxic waste sites, community gardens to farmers' markets, ferries to bike paths and dozens of other possibilities. More than 800 coummunities in 63 countries have green mapped their communities, they are shown on a list or a map on the Green Map website. A picture is worth a thousand words: icons and what they represent can be found on here.
Green Maps may be oriented towards energy ( New York City), tourism (Toronto), social justice (Washington D.C.), land use (Hiroshima Hiroshima), or whatever theme suits the author.
Regardless of the focus, a carefully crafted map may allow readers to discern unforeseen patterns of urbanization, pollution, availability of amenities, etc. Similarly, these maps can be useful for purposes other than those intended by the cartographer. There are numerous non-ecotourism maps that are a useful tool for finding unconventional sites to visit when traveling.
Although Cambridge Green Map was initially created in an attempt to educate others about the many resources available in the community, much was also learned about Cambridge in the mapping process; the classic phenomenon of a deeper understanding of a subject being developed in the process of teaching others.

Making Green Maps
If you are considering creating a map of your neighborhood or town, you might be interested in the stories of a few projects from around the world at http://greenatlas.org.
Green Maps are local projects created by people of a community. Each map is independently managed by Green Mapmakers who share their progress, resources and experiences to benefit others in a global movement to promote Green Living.
Some projects are created using sophisticated graphics or mapping software, but others have had success with simple pen and paper. Another alternative is a web-based system known as Open Green Map which is built on top of Google Maps, and allows anyone in a community to easily contribute to the project.


